Modified cardiovascular SOFA score in sepsis: development and internal and external validation - BMC Medicine - BMC Medicine
Study population and characteristics of 4 cohorts
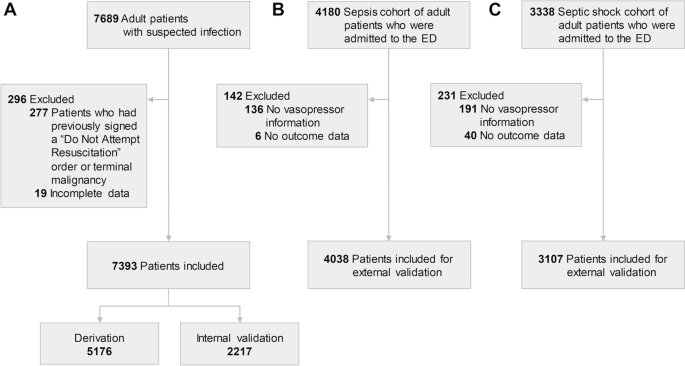
We screened 7689 adult patients in the suspected infection cohort. We excluded patients who had previously signed a "Do Not Attempt Resuscitation (DNAR)" order or patients with terminal malignancy who had limitations on invasive care (n = 277) and patients with incomplete data (n = 19) (Fig. 1). Data from the remaining 7393 patients were included in the analysis. Among these patients, 70% (n = 5176) were assigned to the derivation cohort and 30% (n = 2217) were assigned to internal validation cohort. Of 4180 patients with sepsis who visited the ED, 4038 patients were included in the sepsis registry, external validation cohort 1. The septic shock cohort was used as the external validation 2 cohort. Among 3338 patients in this cohort, exclusions resulted in the use of data from 3107 patients in the analysis.

Flow charts of the study population: suspected infection, sepsis, and septic shock cohorts. A The study population for derivation and internal validation. This cohort included patients who were suspected of having infection in a single university hospital. B An external validation cohort which included sepsis patients in three university hospital emergency departments. C Another external validation cohort which included septic shock patients in multi-center emergency departments
The demographic, clinical characteristics, and outcomes of the four cohorts (derivation, internal validation, and external validation cohorts 1 and 2) are presented in Table 1. The mean maximal total SOFA score in the derivation, internal validation, and external validation cohorts 1 and 2 were 3.1, 3.1, and 7.1 and 8.1, respectively. The 28-day mortality in the derivation, internal validation, and external validation cohorts 1 and 2 were 7.7%, 8.2%, and 21.4% and 20.5%, respectively. Other variables are outlined in Table 1, and the numbers of missing values are presented in Additional file 1: Table S4.
Modified CV SOFA score development
We constructed 28 candidate models. Additional file 1: Table S1 and Table S2 show the cut-off values of MAP, norepinephrine equivalent dose, and lactate level for each of the 28 cardiovascular SOFA scores. Cut-off doses of the models were selected by the tertile of norepinephrine equivalent doses, the closest-to-(0,1) (0.2 µg/kg/min), the Youden index (0.25 µg/kg/min), and "a priori" values (0.5 and 1.0 µg/kg/min) in the derivation cohort. Among the models tested, the modified models with vasopressor use and lactate level outperformed the original and vasopressor only models (Tables 2 and 3). Traditionally, however, CV SOFA scoring system uses blood pressure and vasopressor use without lactate level, we selected and included one best model among vasopressor only models, which was further analyzed with vasopressor use and lactate level models. Distribution and 28-day mortality according to modified SOFA scores of the candidate models in the derivation cohort are shown in Additional file 1: Fig. S2, and AUROCs are shown in Additional file 1: Fig. S3. Calibration curves and statistics of all models are shown in Additional file 1: Fig. S4 and Additional file 1: Table S5 and S6. Regarding lactate cut-off level, AUROC showed that 2 mmol/L was more appropriate for discrimination than 4 mmol/L. Among 16 models of vasopressor use and lactate, the M3 model was selected for the final modified CV SOFA score based on the discrimination, calibration, and incidence and mortality rate according to each SOFA score (Table 2). AUROCs were similar in models 9, 11, 13, and 15 to that of model 3, but the difference in mortality rate between CV SOFA 1 and 2 was not evident in those models. Therefore, we decided that M3 was the most appropriate final model. Another comparison example is that between models 1 and 3. The difference between models 1 and 3 is the cut-off for NE dose. In model 1, 0.1 and 0.2 mg/kg/min were used; in model 3, 0.2 and 0.5 µg/kg/min were used. While the differences in mortality rates among CV SOFA scores, AUROC, and calibration were similar in models 1 and 3 in the derivation cohort, we selected model 3 because the interval between 0.1 and 0.2 mg/kg/min is too narrow. Supporting this, the AUROCs of model 3 in the external validation cohorts were higher than those of model 1. Another comparison requiring comment is the one between M3 and M5. The difference between M3 and M5 is the NE cutoff. In M5, 0.25 µg/kg/min was used; 0.2 µg/kg/min was used in M3. Although the performance of M3 and M5 is similar, the AUROC of M3 was higher than that of M5 (0.682 vs 0.681). Also, 0.2 µg/kg/min is more "user friendly," more easily calculated, than 0.25 µg/kg/min. Therefore, we selected M3 over M5.
Incidence and 28-day mortality of original vs. modified CV SOFA score
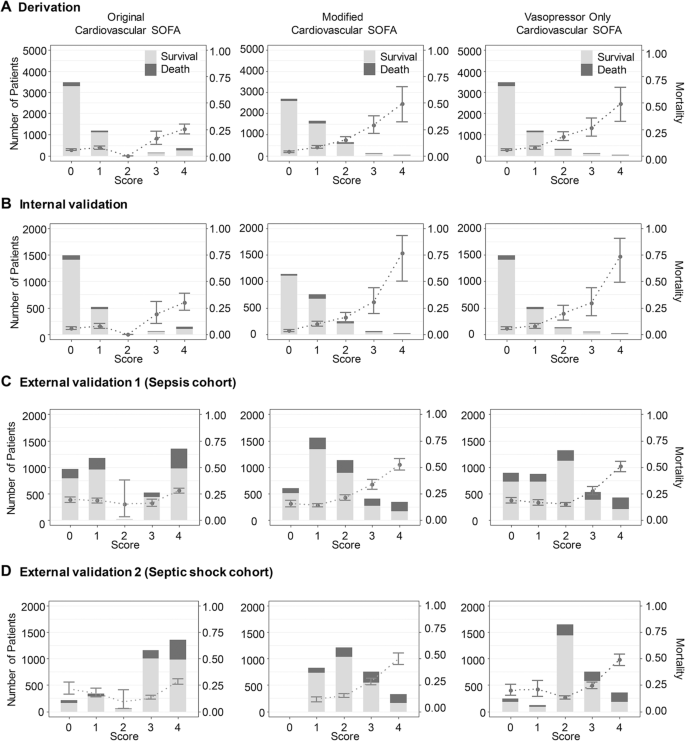
We analyzed the 28-day mortality of the original CV SOFA score and modified CV SOFA score in 4 cohorts (derivation, internal validation, external validation 1 and external validation 2 cohorts) (Fig. 2). There were too few patients with an original CV SOFA score of 2, and the 28-day mortality of patients with a CV SOFA score of 2 was lower than that of patients with an original CV SOFA score of 0 or 1 in all three cohorts (5.6%, 7.5% and 0% in 0, 1, and 2 original CV SOFA score, respectively in the derivation, 5.8%, 7.7%, and 0% in 0, 1, and 2 original CV SOFA score, respectively in the internal validation, 19.0%, 18.4% and 15.0% in 0, 1, and 2 original CV SOFA score, respectively in the external validation 1, and 21.3%, 17.1%, and 9.1% in 0, 1, and 2 original CV score, respectively in the external validation 2). The 28-day mortality increased as the modified CV SOFA score increased in all three cohorts (3.9%, 8.4%, and 14.9% in 0, 1, and 2 modified CV SOFA score, respectively in the derivation, 3.3%, 9.9%, and 15.8% in 0, 1, and 2 modified CV SOFA score, respectively in the internal validation, 15.4%, 13.9%, and 21.2% in 0, 1, and 2 modified CV SOFA score, respectively in the external validation 1, and 0%, 11.2%, and 14.7% in 0, 1, and 2 modified CV score, respectively in the external validation 2). The incidence and 28-day mortality of the original total SOFA score and modified total SOFA score were shown in Additional file 1: Fig. S5.

Distribution and 28-day mortality according to the original, modified, and vasopressor only cardiovascular SOFA score for each cohort. The 28-day mortality showed a linear increase with the modified cardiovascular SOFA score. Bar graphs represent the number of patients, and points with error bars indicate 28-day mortality with 95% confidence interval. Abbreviation: SOFA, sequential organ failure assessment
The discrimination and calibration of original vs. modified CV SOFA score
The AUROC of the original CV SOFA for predicting 28-day mortality was 0.624 (95% confidence interval [CI]: 0.596–0.652, Fig. 2) in the derivation cohort. The AUROC of the modified CV SOFA was significantly higher than that of the original CV SOFA (0.682, CI: 0.654–0.709, p < 0.001). The AUROCs of the modified CV SOFA were significantly higher than those of the original CV SOFA: (0.716 vs 0.638, p < 0.001) in the internal validation cohort, (0.648 vs 0.557, p < 0.001) in the external validation cohort 1, and (0.674 vs 0.589, p < 0.001) in the external validation cohort 2.
The AUROC of the original total SOFA for predicting 28-day mortality was 0.75 (CI: 0.725–0.776) in the derivation cohort (Fig. 2). The AUROC of the modified total SOFA was significantly higher than that of the original total SOFA (0.762, CI: 0.738–0.787, p < 0.001). The AUROC of the modified total SOFA was significantly higher than that of the original CV SOFA in the internal validation cohort (0.787 vs 0.773, p = 0.001), in the external validation cohort 1 (0.712 vs 0.678, p < 0.001), and in the external validation cohort 2 (0.736 vs 0.712, p < 0.001).
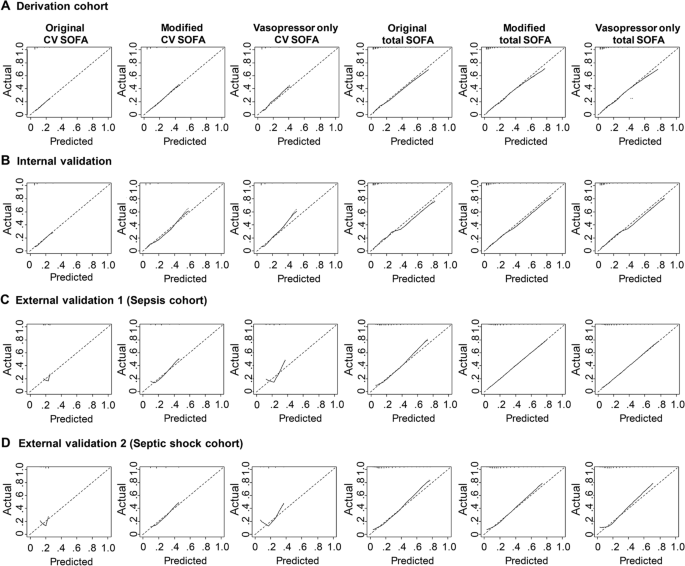
Calibration was evaluated with calibration plots of predicted and observed probability. The calibration curve of the original CV SOFA for 28-day mortality showed good calibration both in the derivation and internal validation cohorts (Fig. 3). There was no significant difference in the calibration curve between the original CV SOFA score and modified CV SOFA score in these two cohorts (Additional file 1: Table S5). However, the original CV SOFA and the vasopressor only CV SOFA showed poor calibration in external validation cohorts 1 and 2, the slope of which were 1.029 and 1.127, respectively (Fig. 3 and Additional file 1: Table S5, S6). In contrast, the modified CV SOFA score showed good calibration in these cohorts. There were no significant differences in the calibration curve between the original total SOFA score and modified total SOFA score both in the derivation and internal validation cohorts, but the modified total SOFA score had slightly better calibration than the original total SOFA score in external validation 1 and 2 cohorts, the slope of which were 1.003 and 0.986, respectively (Additional file 1: Table S5).

Calibration plots for 28-day mortality between the original, modified, and vasopressor only cardiovascular/total SOFA
Adjusted AUROC of the original vs. modified CV/Total SOFA score
Age, gender, and presence of underlying diseases (for example diabetes mellitus, hypertension, stroke, chronic lung disease, hematologic malignancy, and metastatic malignancy) were used as covariates in the adjusted AUROC calculation. Adjusted AUROCs of the original CV SOFA score, the modified CV SOFA score, the original total SOFA score, and modified total SOFA score for 28-day mortality in the derivation, internal validation, external validation 1, and external validation 2 cohorts are shown in Additional file 1: Table S7. The adjusted AUROCs of modified CV and total SOFA scores were significantly higher than those of the original CV and total SOFA scores (the modified vs. the original CV SOFA, 0.632 vs. 0.541 in the derivation, 0.671 vs. 0.575 in the internal validation, 0.640 vs. 0.552 in the external validation 1, and 0.669 vs. 0.570 in the external validation 2 cohorts, p < 0.05 for all comparisons; the modified vs. the original total SOFA, 0.735 vs. 0.717 in the derivation, 0.760 vs. 0.743 in the internal validation, 0.712 vs. 0.676 in the external validation 1, and 0.738 vs. 0.712 in the external validation 2 cohorts, p < 0.05 for all comparisons).
Classification as sepsis and mortality rate according to the original CV SOFA and the Modified CV SOFA
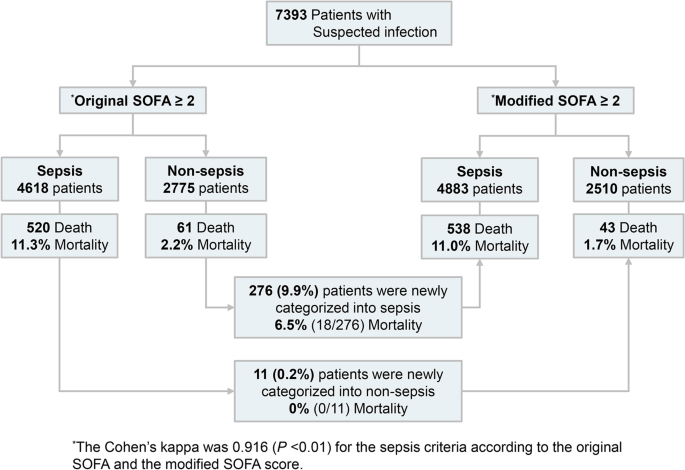
The validity of the modified SOFA score to identify patients with suspected infection who are at risk of sepsis was evaluated using the suspected infection cohort. Among the 7393 cases with suspected infection, 4618 (62.5%) patients (original SOFA) and 4883 (66.0%) patients (modified SOFA) were categorized into sepsis patients with an increase of 2 points or more (Fig. 4 and Additional file 1: Table S8). Among non-sepsis patients by the original SOFA score, 276 patients were newly classified as sepsis by the modified SOFA. The 28-day mortality was 6.5% for these patients. Of the 11 patients classified as sepsis by the original SOFA that were classified as non-sepsis by the modified SOFA, the 28-day mortality rate was 0%. The sensitivity of the clinical sepsis criteria by the modified SOFA was higher than the original SOFA (92.6% vs. 89.5%), but the specificity was lower (36.2% vs. 39.8%) (Additional file 1: Table S9). There was no statistical difference in the AUROC of an increase of 2 or more points in the original SOFA and in the modified SOFA (0.647 vs 0.644, p = 0.49). The vasopressor only cardiovascular SOFA did not change the distribution of the sepsis criteria compared with the original SOFA.

Classification as sepsis and mortality rate according to the original and modified cardiovascular SOFA. The 276 patients who were classified as non-sepsis by the original SOFA score and were classified as sepsis by the modified SOFA score had a 28-day mortality of 6.5% (n = 18). Of the 11 patients classified as sepsis by the original SOFA who were classified as non-sepsis by the modified SOFA, the 28-day mortality rate was 0% (n = 0)
Other CV SOFA models
We tested a modified CV SOFA score only using lactate levels as a categorical variable. When the lactate level was less than 1 mmol/L, 0 points were assigned. Between 1 mmol/L and 2 mmol/L, 1 point was assigned. Between 2 mmol/L and 3 mmol/L, 2 points were assigned; between 3 mmol/L and 4 mmol/L, 3 points were assigned; and for 4 mmol/L or more, 4 points were assigned. The AUROC of the lactate-only CV SOFA was significantly higher than the original CV SOFA in the four cohorts (the lactate only CV vs the original CV SOFA, 0.696 vs. 0.624 in the derivation, 0.721 vs. 0.638 in the internal validation, 0.643 vs. 0.557 in the external validation 1, and 0.638 vs. 0.589 in the external validation 2 cohorts, p < 0.05 for all comparisons) (Additional file 1: Fig. S6). We also tested the performance of the original CV SOFA with an equivalent dose of norepinephrine. This did not show improvement in discrimination and calibration compared with the original CV SOFA.
Sensitivity analysis
We used a complete data set for each cohort without missing values for sensitivity analysis (Additional file 1: Fig. S7). The AUROC and calibration curve of the original CV/total SOFA score and the modified CV/total SOFA score showed similar results with all data sets. (the modified vs. the original CV SOFA, 0.686 vs. 0.629 in the derivation, 0.718 vs. 0.640 in the internal validation, 0.647 vs. 0.553 in the external validation 1, and 0.673 vs. 0.586 in the external validation 2 cohorts, p < 0.001 for all comparisons; the modified vs. the original total SOFA, 0.759 vs. 0.746 in the derivation, 0.783 vs. 0.769 in the internal validation, 0.709 vs. 0.673 in the external validation 1, and 0.720 vs. 0.710 in the external validation 2 cohorts, p < 0.001 for all comparisons).
Comments
Post a Comment